 IMAS Metadata Catalogue
Biotic taxonomic identification
Type of resources
Topics
Keywords
Contact for the resource
Provided by
Years
-

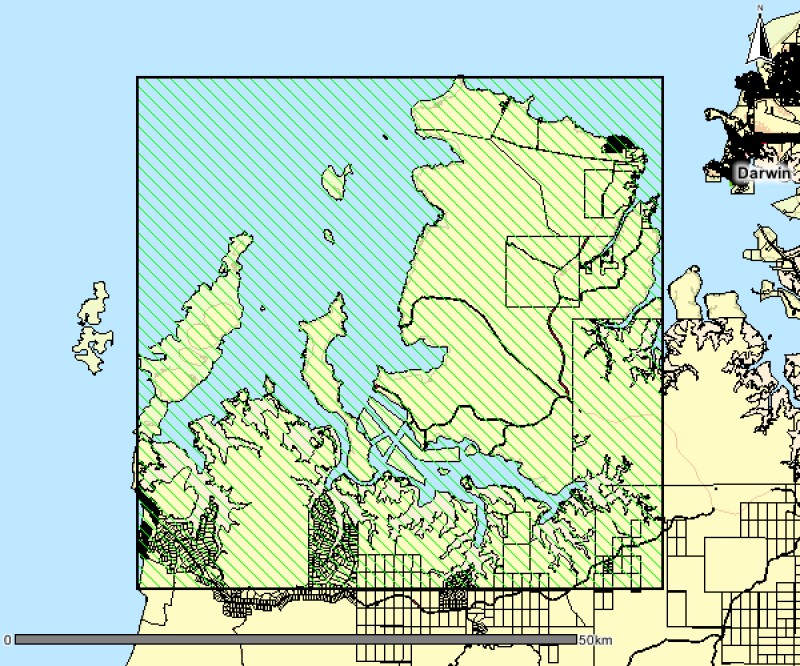
This polygon spatial dataset describes the benthic habitats likely to occur in marine environments around Gunn Point Peninsula and informs the desktop assessment of the marine biodiversity values for the region. The benthic habitats are inferred from existing information but in most cases require further data collection to validate and refine. Habitat modelling forms the basis of benthic community value assessment for Shoal Bay (Galaiduk et al. 2019). The accompanying report Marine and Coastal Biodiversity Assessment of the Gunn Point Area (2020) forms part of the Mapping the Future Project - Gunn Point. This project has identified land capability, water availability and biodiversity values to support land planning and inform development potential over the Gunn Point area. Reports and maps can be viewed from the webpage: denr.nt.gov.au/land-resource-management/development-opportunities - Development Potential of the Gunn Point Area (2020) - Biodiversity Assessment of the Gunn Point Area (2020) - Groundwater Resources of the Gunn Point Area (2020) - Marine and Coastal Biodiversity Assessment of the Gunn Point Area (2020) - Soil and Land Resources of the Gunn Point Area (2020) - Soil and Land Suitability Assessment for Irrigated Agriculture in the Gunn Point Area (2017) - Vegetation Communities of the Gunn Point Area (2020)
-
This spatial polygon dataset is derived from the 2001 mapping of mud crab (Scylla serrata) habitats along the NT and Queensland coastal wetlands. The polygons were derived from Landsat imagery and verified with field work and is suitable for use at scale 1:100,000. The information can be used in many ways to assist the management of these habitats. It provides a suitable baseline dataset for monitoring broad scale changes in area and composition of coastal wetland communities. Additionally, it provides information required by managers for choosing representative habitats for protection.
-
This is a collection of polygons outlining signficant seagrass meadows around Arnhem Land, Kakadu and Gulf of Carpentaria coastal waters for the Northern Australia Marine Biodiversity Survey (NAMBS) project between 2003 and 2005. Data was collected from imagery and ground truthed by observers from helicopter and insitu sample grabs.
-
This is a high resolution survey (1:5,000 scale dataset) describing mapped vegetation communities for the Ludmilla Creek catchment area (within the City of Darwin, Northern Territory). (Vegetation Unit - A reasonably homogeneous part of the land surface, distinct from surrounding terrain with constant properties in landform and vegetation) This vegetation survey was undertaken in 1996. This dataset represents the vegetation on the ground at the time of the survey and reflects the data and methods used to create the mapped polygons. The dataset has been revised in 2015 to include community descriptions but has not been updated to reflect the vegetation on the ground. The Darwin Remnant Vegetation Survey is considered a more up-to-date representation of vegetation for this area.
-
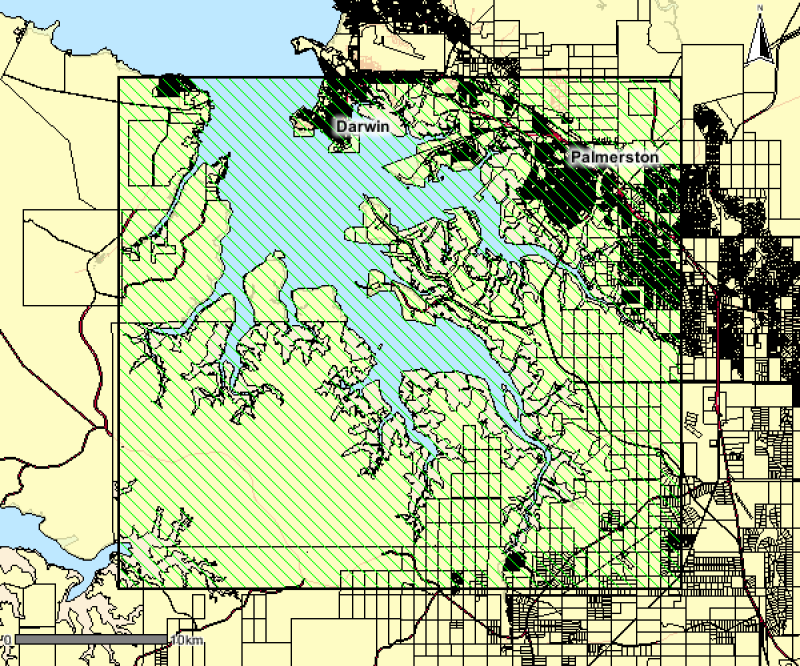
This polygon spatial dataset describes the mangrove communities for Darwin Harbour and its environs and was surveyed at a mapping scale of 1:25 000. The associated report notes an area of approximately 20,400 hectares of mangroves in Darwin Harbour and describes ten main mangrove associations or communities. The data provides a basis for identifying the extent and distribution of mangrove communities for Darwin Harbour and its environs.
-
This polygon spatial dataset describes the mangrove communities for Bynoe Harbour and its environs. The original field survey was undertaken in 1998 at a mapping scale of 1:25,000. The associated report notes an area of approximately 24,000 hectares of mangroves in Bynoe Harbour and describes ten main mangrove associations or communities. The data provides a basis for identifying the extent and distribution of mangrove communities for Bynoe Harbour and its environs. Mangrove mapping was updated over this area in a 2016 survey. See metadata record for Mangrove Community Mapping - Charles Point to Gunn Point. www.ntlis.nt.gov.au/metadata/export_data?type=html&metadata_id=87F656131848A609E050CD9B214417E1
-
Spatially referenced underwater video transect data for Tasmanian coastal waters from the LWM (Low water mark) to 80 metres in depth or 1.5 kms from shore.
-
Seagrass meadows within the Broadwater were mapped using high-resolution 2005 orthorectified color aerial photography obtained from the Gold Coast City Council at a scale of 1:10,000 and pixel size 0.15 m. Using desktop GIS mapping (MapInfo Professional 8.0), polygons were drawn over all potential seagrass meadows at a scale of 1:5000. Spatial accuracy was estimated to be approximately ± 1 m on well-defined boundaries (e.g. dense seagrass meadows) and ± 2 m along poorly defined boundaries (e.g. sparse seagrass meadows).
-

[This data has been superseded by a synthesised global dataset which includes additional ecological data contributed by non-RLS entities (National Reef Monitoring Network). Please visit the corresponding NRMN Collection (IMOS - National Reef Monitoring Network Sub-Facility - Global off-transect species observations || Global reef fish abundance and biomass) for the most current version of this data. See "Downloads and Links" section below.] This dataset contains records of bony fishes and elasmobranchs collected by Reef Life Survey (RLS) divers along 50m transects on shallow rocky and coral reefs, worldwide. Abundance information is available for all records found within quantitative survey limits (50 x 5 m swathes during a single swim either side of the transect line, each distinguished as a Block), and out-of-survey records are identified as presence-only (Method 0). Although surveys are undertaken as part of monitoring programs at particular locations (mostly in Australia), this dataset contains does not include repeat surveys of sites.
-
This dataset summarises 30 years of seagrass data collection (1984-2014) within the Great Barrier Reef World Heritage Area. The Meadow data describes seagrass at 1,169 individual or composite meadows. The data includes information on species, meadow type and age and reliability of the data. Data represented in this dataset has been collected by the TropWATER Seagrass Group and CSIRO in a GIS database. In making this data publicly available for management, the authors from the TropWATER Seagrass Group request being contacted and involved in decision making processes that incorporate this data, to ensure its limitations are fully understood. The site and meadow GIS available on eAtlas should be considered a “living” document that will be updated and modified as new data become available. Additional 'point' site data, and alternative download formats are available from eAtlas. https://eatlas.org.au/geonetwork/srv/eng/catalog.search#/metadata/77998615-bbab-4270-bcb1-96c46f56f85a A later version (2020) of this dataset including 35 years of data has been published under "Seagrass mapping synthesis: A resource for coastal management in the Great Barrier Reef (NESP TWQ Project 3.2.1 and 5.4, TropWATER, James Cook University)." https://eatlas.org.au/data/uuid/5011393e-0db7-46ce-a8ee-f331fcf83a88 Data Dictionary: Seagrass meadow data: - NRM_REGION: The NRM region in which the survey occurred. - SURVEY_DAT: Survey month and year, or a list of survey dates for meadows repeatedly sampled. - METHOD: Sampling and mapping methods – GPS/aerial photography, helicopter, walking, boat with camera, diver, grab and/or sled. - PERSISTENC: Meadows were classed according to four categories: Stable, Variable, Highly variable ephemeral, or Unknown. - MEADOW_LOC: Meadows were classed according to three categories, although some meadows cover a range of these locations: Intertidal, Shallow subtidal, or Deep subtidal. - DENSITY: Meadow density categories (light, dense, variable among years, unknown) were determined by the consistency of mean above-ground biomass of the dominant species among all years sampled. - DOMINANT_S: Dominant species and species present. - SPP_PRESEN: All species present. - MEAN_BIOMA: Mean meadow biomass in g DW m-2 (+ standard error if available), or the minimum and maximum biomass recorded for meadows sampled more than once. - AREA_HA: Meadow area in hectares (+ reliability estimate if available), or the minimum and maximum area recorded for meadows sampled more than once. - HECTARES: Total extent of meadow (HA) - PERCENT_CO: Meadow percent cover - this value represents mean seagrass percent cover, or the range of percent cover (if >1 number in the data cell). Meadow percent cover was most commonly calculated in pre-1990s surveys and recorded as “n/a” if not available. - CUSTODIAN: Data custodians - COMMENTS Meadow Persistence: - Stable: enduring meadow form; seagrass presence, biomass and area expected to be stable over time and seagrass meadow expected to be a permanent feature apart from extreme events or sustained long term impacts; - Variable: meadow presence, biomass and area expected to fluctuate within and among years, but generally some seagrass expected to be present apart from extreme events or sustained long term impacts; - Highly variable ephemeral: meadow not persistent over time; at some time periods seagrass will be present and at other times absent. Ephemeral meadows that have a naturally extreme level of variation in area and biomass within and among years; - Unknown: undetermined persistence as meadow sampled only once. Meadow Location: - Intertidal - all sites surveyed by helicopter or walking within a meadow and/or comments in field books identified an intertidal meadow, - Shallow subtidal - meadows where free divers SCUBA, sled collection, or cameras were used to sample and water depth was generally <10 m; - Deep subtidal - for this project meadows >10 m deep were included as deep subtidal.